
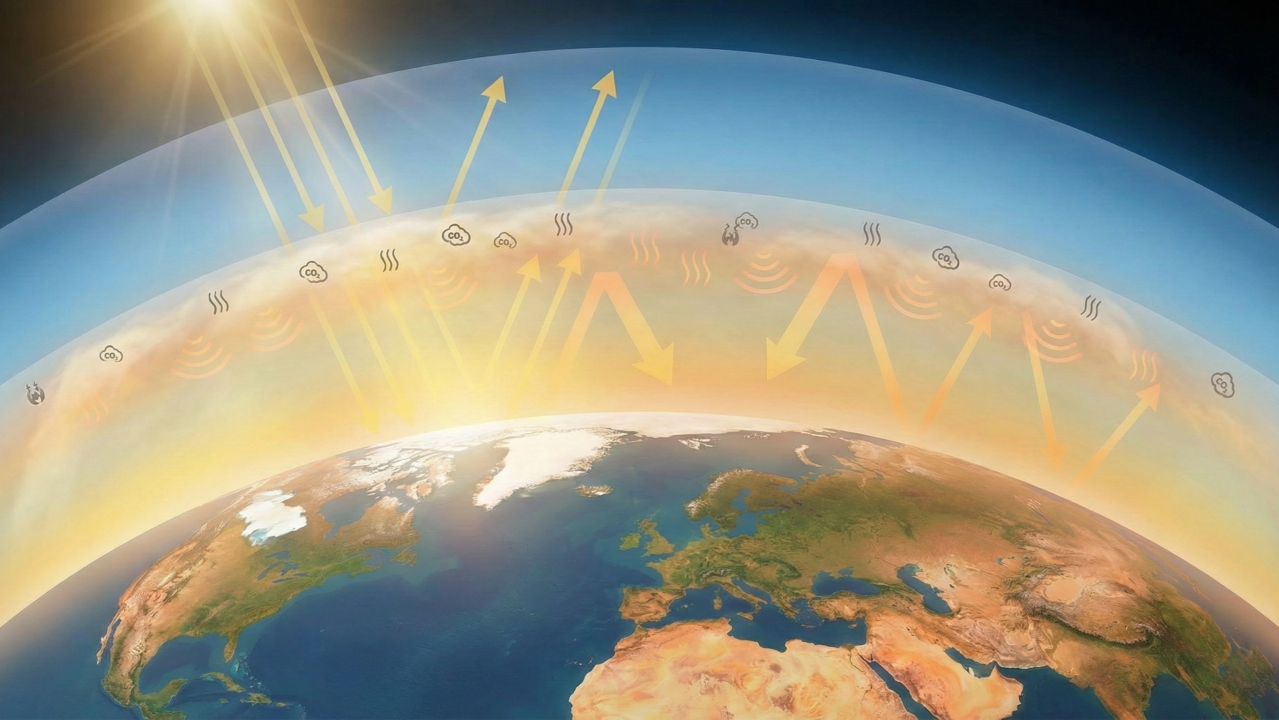
The recent severe frosts experienced at the beginning of 2026—likely associated with the destabilization of the polar vortex—may suggest that the climate remains unchanged. In reality, such phenomena are elements of weather variability, which should not be confused with long-term climate characteristics. Weather is a temporary state of the atmosphere, whereas climate is an averaged description of conditions over a multi-year period. In building design, long-term statistics are of key importance, rather than individual seasons or subjective experiences. To make data-driven design decisions, it is necessary to use standardized climate datasets, such as EPW files. They allow for the analysis of environmental conditions in a consistent and comparable manner, which directly translates into energy parameters and user comfort
The comparative analysis presented in the text was conducted in the Grasshopper environment using the Ladybug Tools climate analysis package. The study is based on a compilation of data for Warsaw from the historical period of 1971–2000 and a contemporary dataset covering the years 2009–2023. For the city center area, an additional correction was applied using the Urban Weather Generator (UWG), accounting for the urban heat island effect through precise modeling of built environment parameters and paved surfaces.
The EPW file as a starting point
The EPW (EnergyPlus Weather) file is the primary source of climate data in energy simulations. Its structure is often based on the so-called Typical Meteorological Year (TMY), a synthetic set of months most statistically representative of a given period. A dataset created in this way contains 8,760 hours of data and enables the analysis of standard climate parameters. However, the reference period of the base data is crucial. Files available in public databases are sometimes based on outdated statistics. For Warsaw, it is still easy to encounter datasets from 1971–2000, which do not fully reflect the changes that have occurred in recent decades. Designing based on older data leads to an underestimation of cooling loads and an overestimation of the heating season’s significance, which is confirmed by the comparative analysis of historical and contemporary files conducted for the purpose of this article.
Air temperature. Regeneration and thermal mass
The analysis should begin with the dry-bulb temperature, i.e., the standard air temperature measured by a sensor shielded from direct solar radiation and moisture. A comparison of the graphs indicates a clear shift in the distribution of values between the analyzed periods. In the winter months, an elevation of the lower temperature ranges is observed. Extreme sub-zero values occur less frequently than in the 1971–2000 period, although they still determine the peak load sizing of heating systems. The fundamental change, however, occurs in the summer season, where an increase in maximum temperatures and a higher number of hours above 30°C are noticeable.
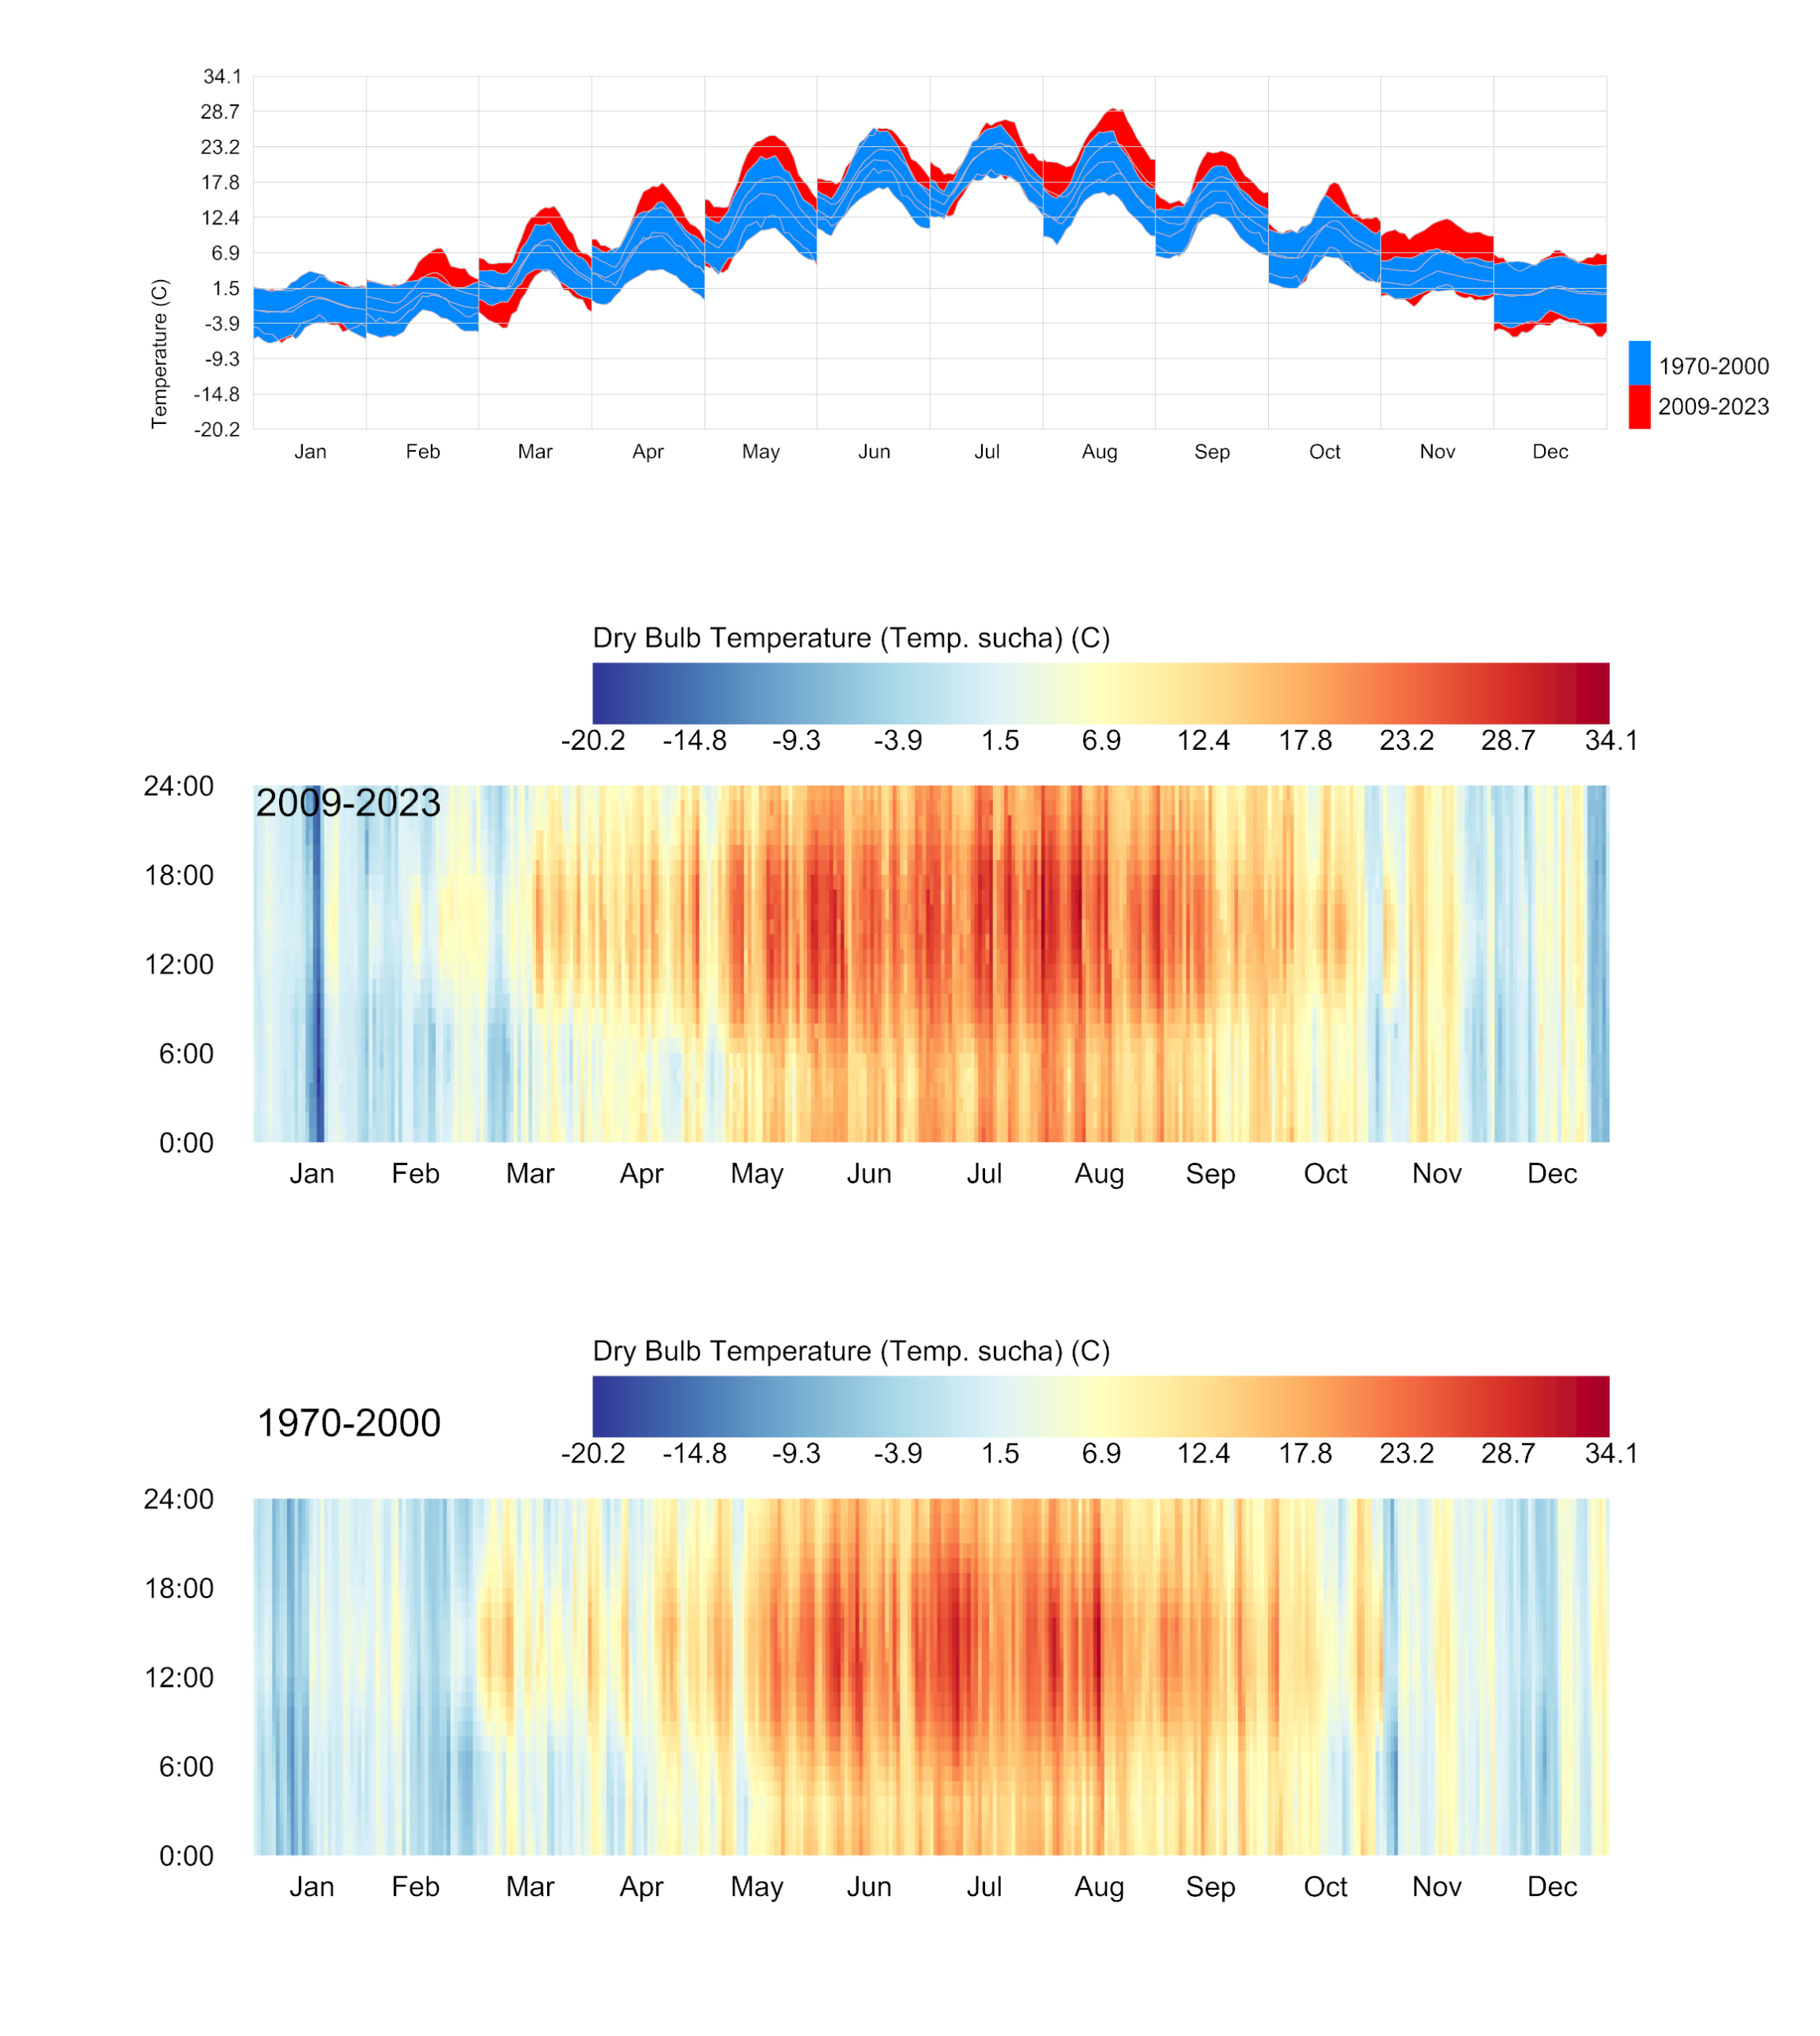
Fig. 1. Comparison of air temperature ranges (Dry-bulb). Blue: range for the years 1971–2000. Red: range for the years 2009–2023. Visible elevation of winter minimums and increase in summer maximums.
A particularly significant phenomenon, evident in the new data, is the occurrence of tropical nights, during which the temperature does not drop below 20°C. This has dual negative consequences. From a physiological perspective, the lack of nocturnal cooling prevents effective body regeneration during sleep, leading to chronic fatigue and cardiovascular strain. Simultaneously, in the context of building physics, this phenomenon blocks the possibility of passive night cooling of the facility. The thermal mass (mainly walls), which accumulated heat gains during the day, cannot release the stored energy at night. Consequently, the building begins the next diurnal cycle with a higher temperature, which amplifies the overheating effect and forces intensive operation of air conditioning systems.
UTCI. The physiology of heat stress
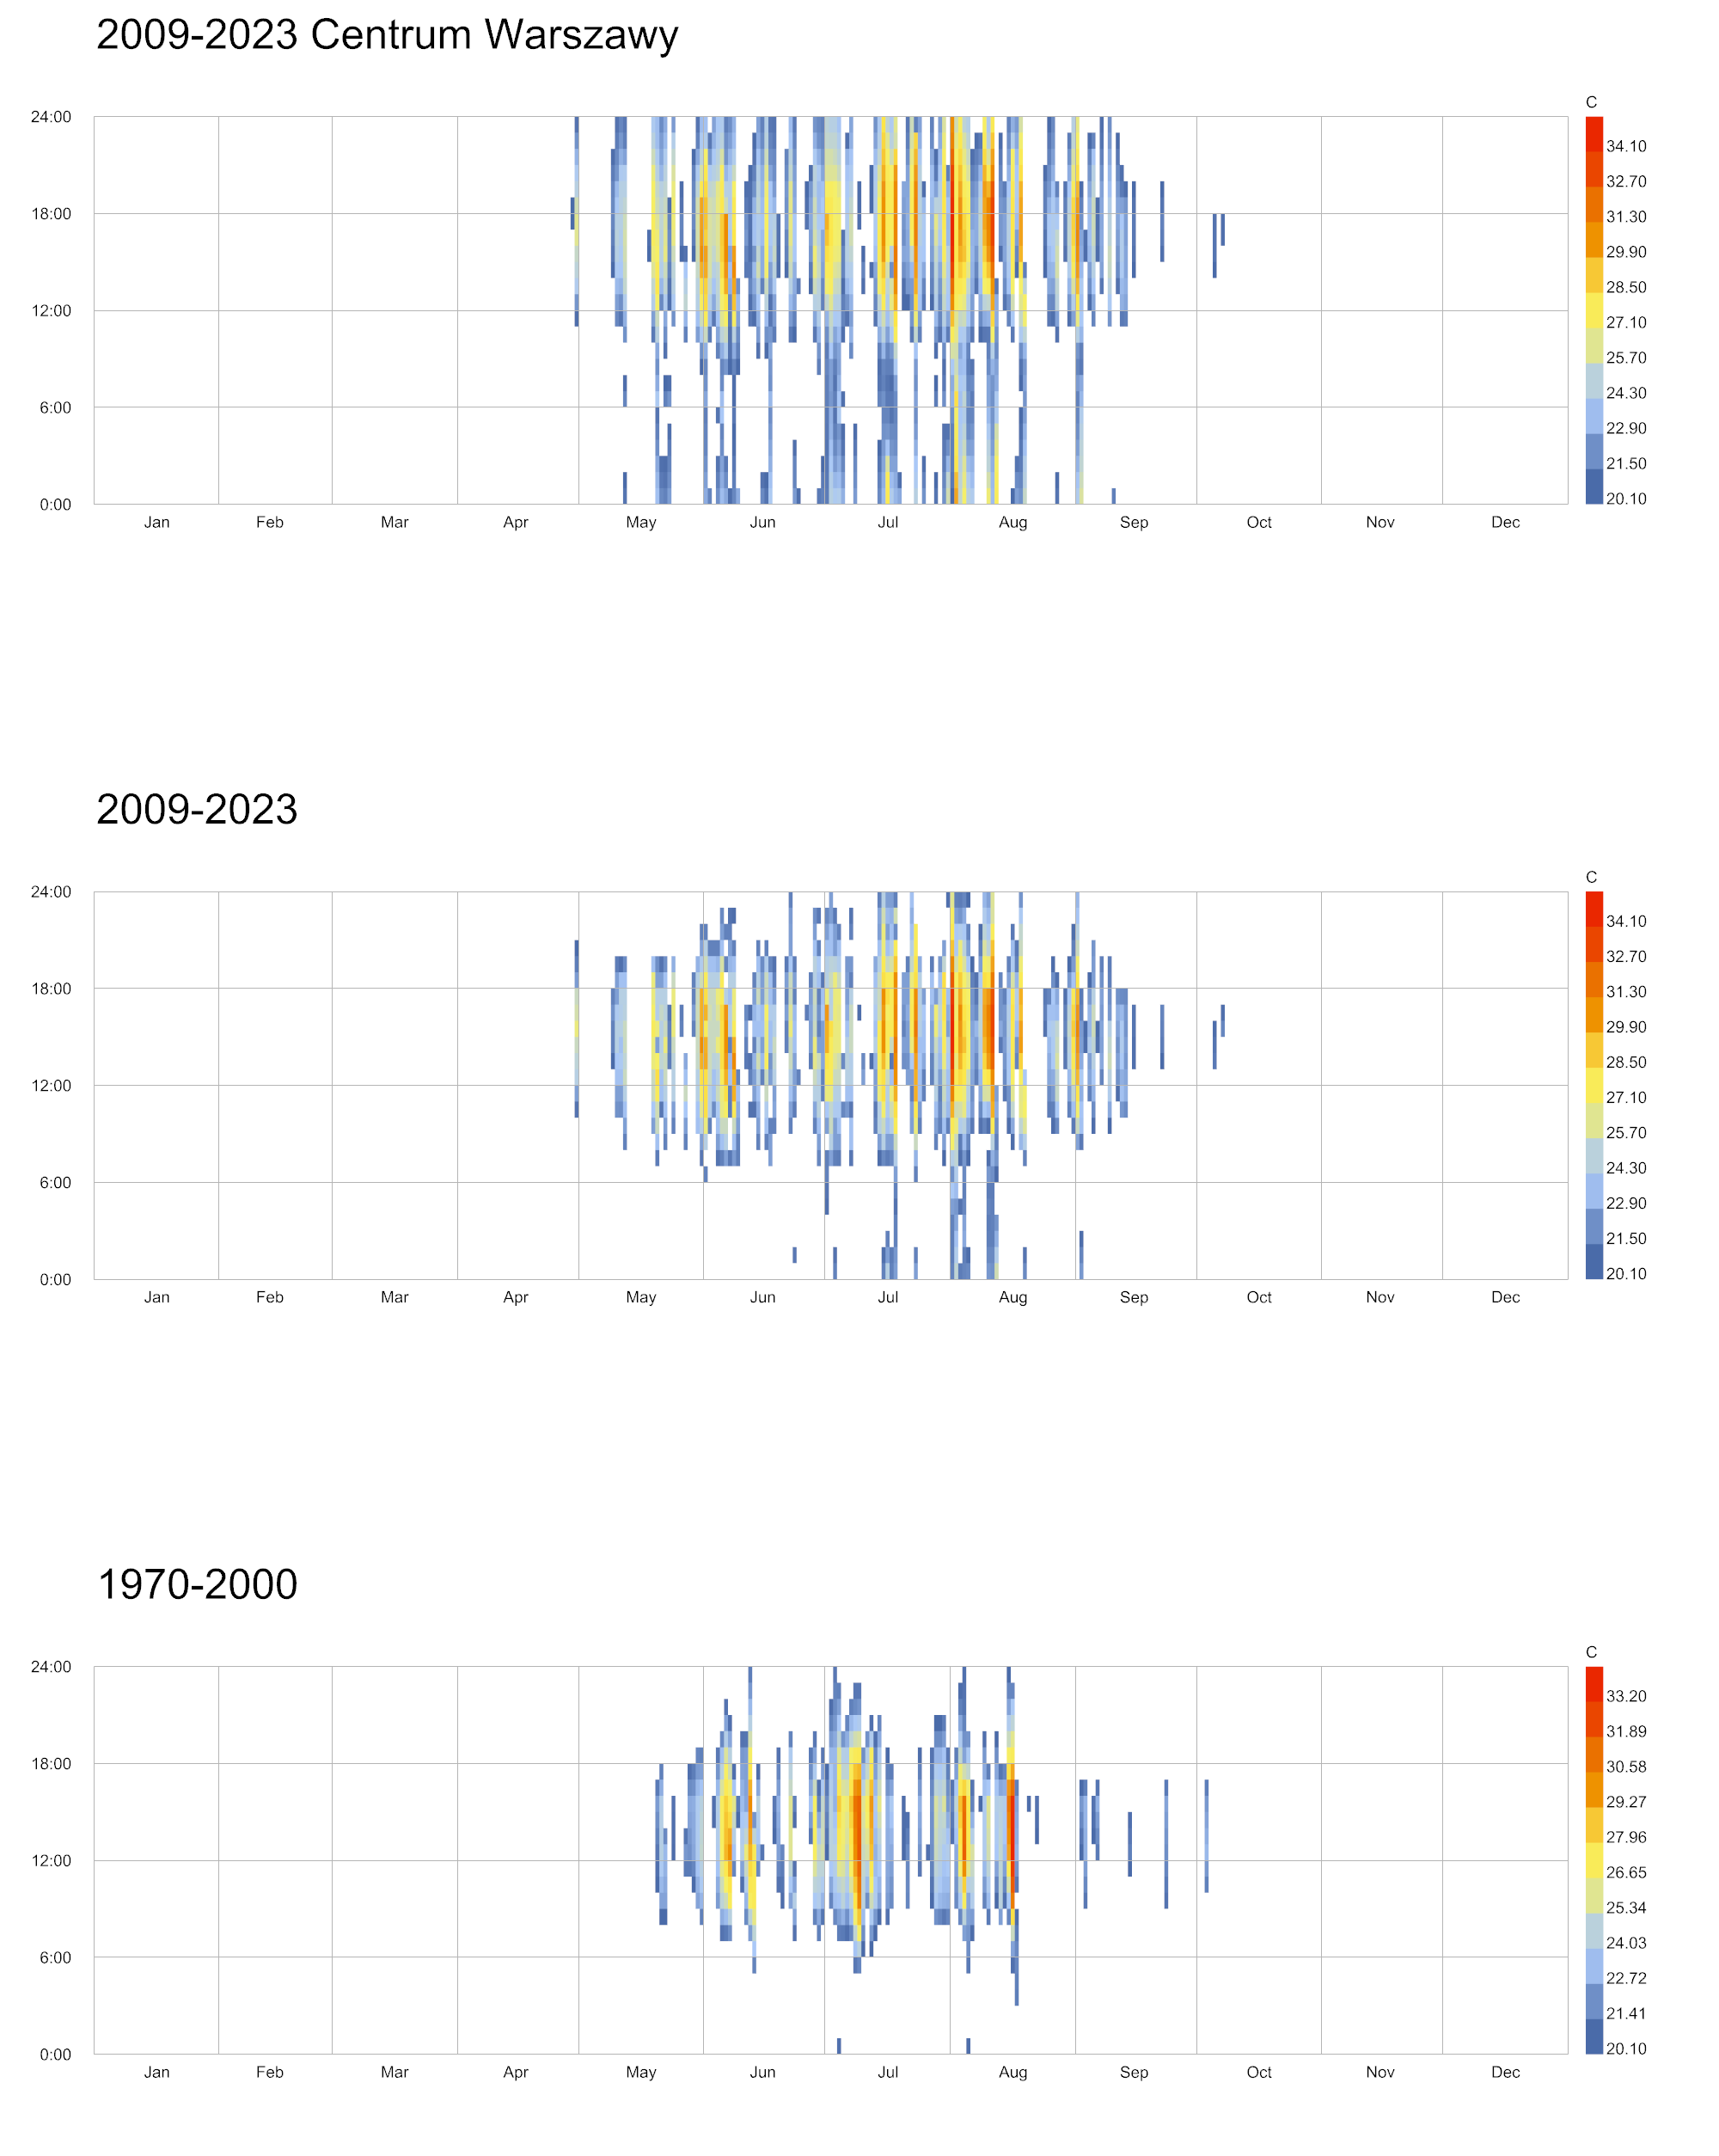
Analyzing air temperature alone is insufficient for assessing comfort, as it omits other environmental factors. The UTCI (Universal Thermal Climate Index) allows for the evaluation of the actual perception of conditions by integrating temperature, humidity, wind speed, and mean radiant temperature. In the more recent period, a decrease in the number of hours corresponding to strong cold stress and an increase in the number of hours associated with heat stress are visible. Values exceeding 32°C UTCI appear much more frequently than in the historical data.
Heat stress is a state of physiological strain in which the body must actively struggle for thermoregulation through vasodilation and intensive sweating. For users, this means a decline in cognitive functions and health risks. From an architectural point of view, the increase in the UTCI value forces a redefinition of the external envelope’s role. The facade ceases to be merely a thermal barrier protecting against heat loss and becomes a filter reducing radiant heat gains, which is the main factor driving up the perceived temperature indoors.
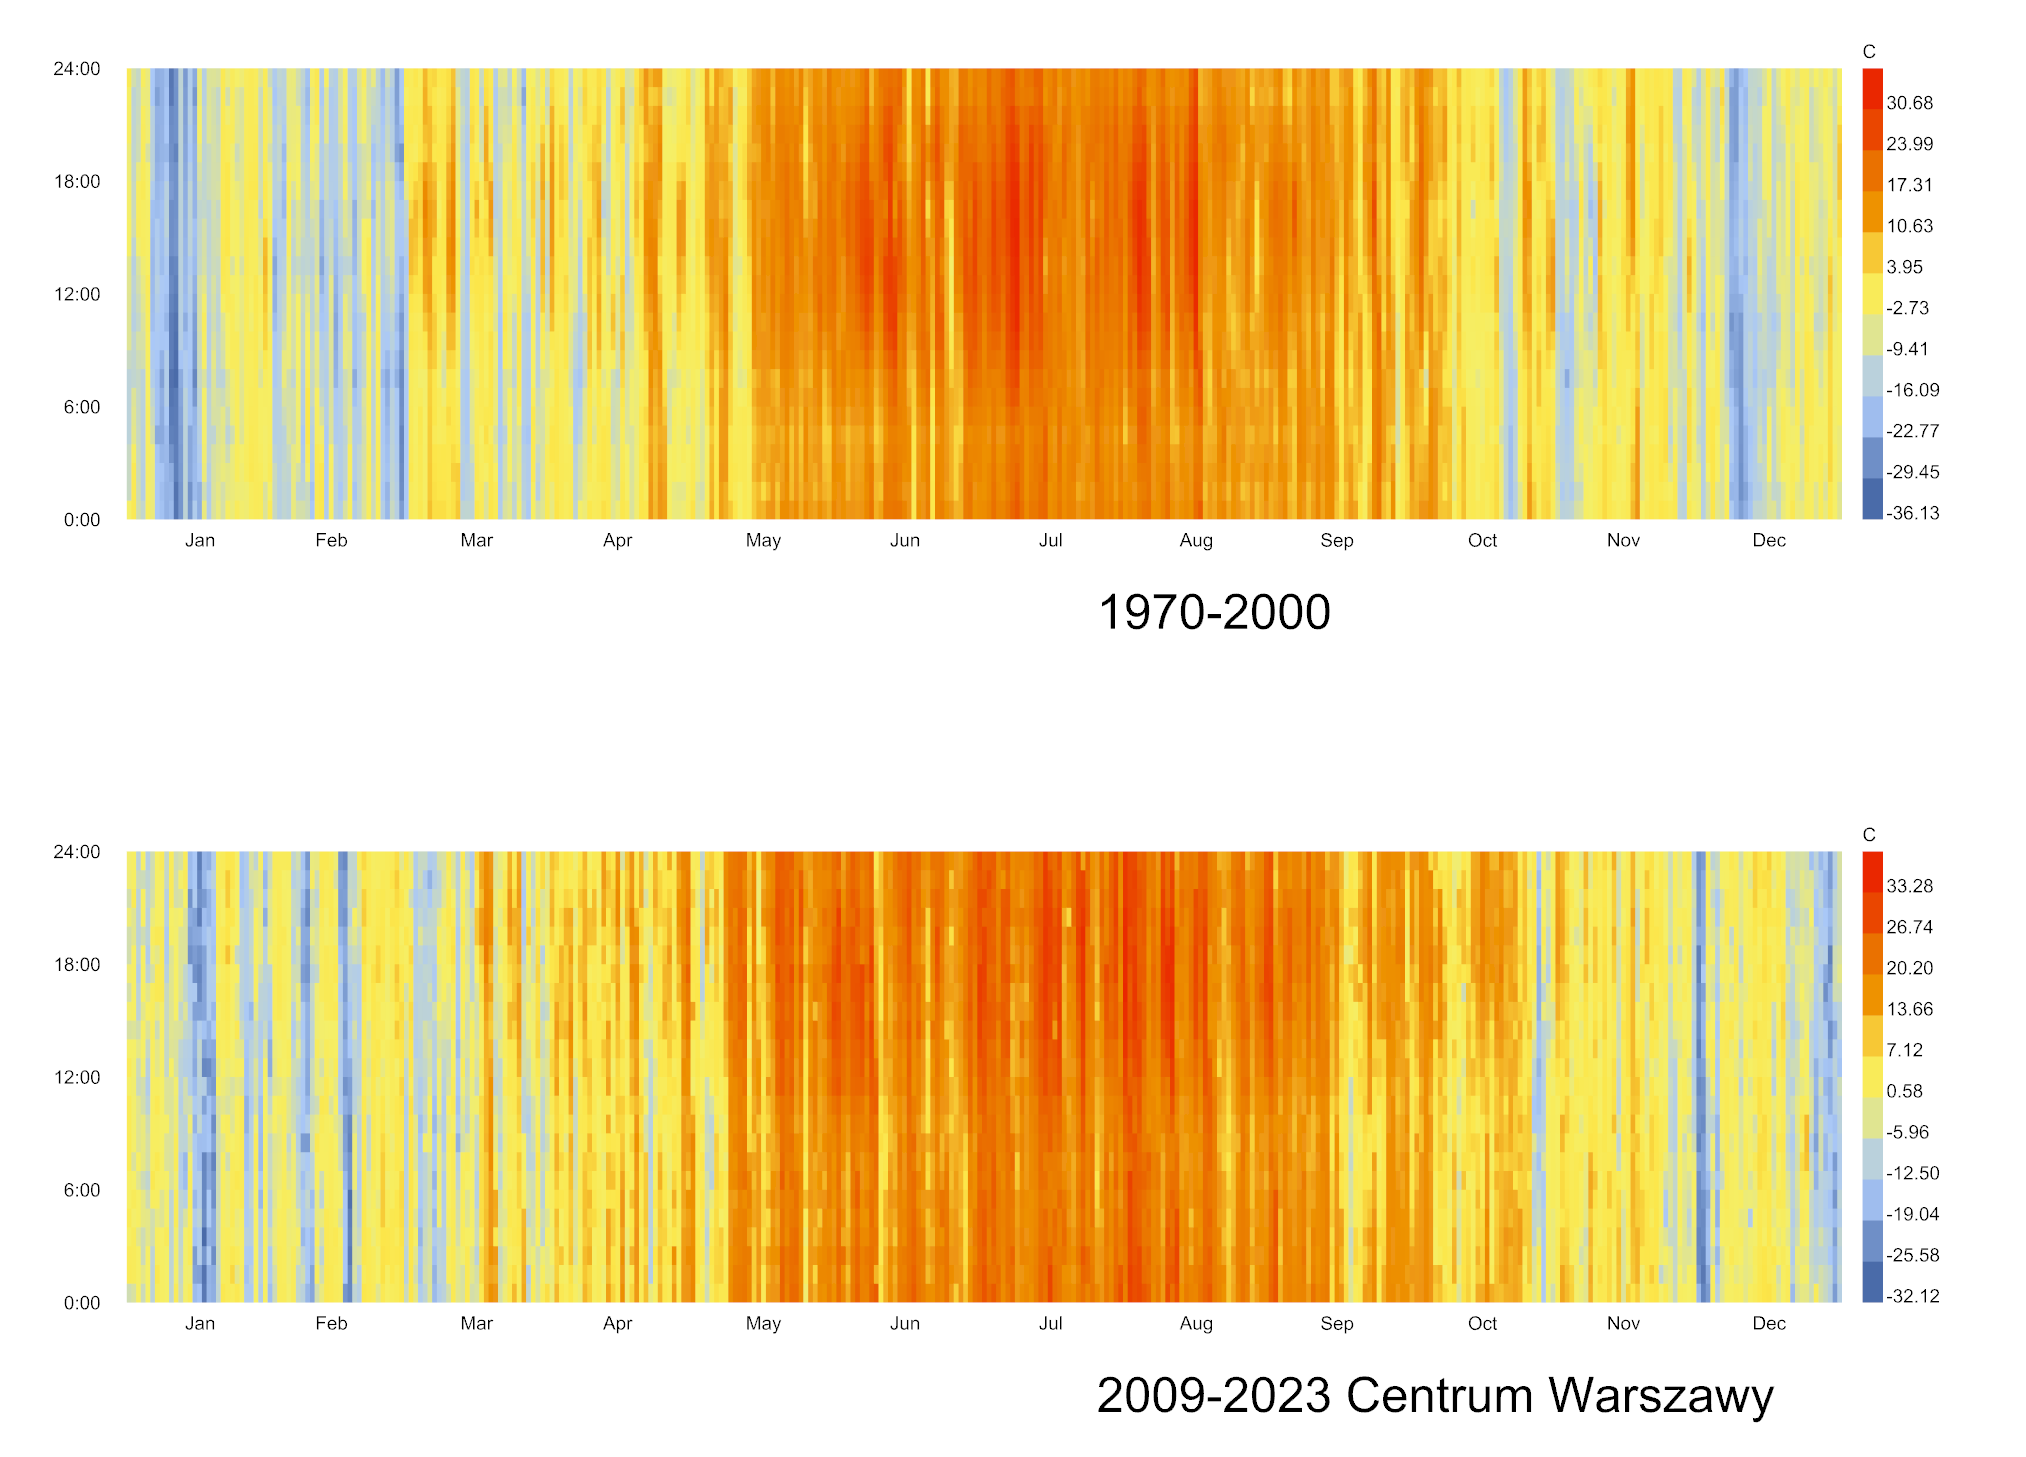
Fig. 2. UTCI heatmap. Comparison of the 1970–2000 period (top) and 2009–2023 for the city center (bottom). Dark red bands indicate an increase in the frequency of strong heat stress (>32°C) in the summer months.
Psychrometrics. Limits of passive cooling
The psychrometric chart (Mollier diagram) is a graphical representation of moist air properties, where the horizontal axis represents temperature and the vertical axis represents moisture content. A key informative element is the “comfort polygon” superimposed on the chart—an area defining the range of parameters in which most people do not experience discomfort. A comparison of the data shows that in the more recent period, an increasing number of hours fall into the area on the right side of the polygon, characterized by higher temperature and greater moisture content.
This situation is unfavorable for the human body—high humidity limits the efficiency of sweat evaporation, the primary mechanism of body cooling. This leads to a sensation of severe stuffiness even at temperatures that would be acceptable in dry air. This translates directly to the effectiveness of passive strategies in architecture. Natural ventilation loses its cooling function during hot and humid periods. Introducing air with a high water vapor content into the interior can deteriorate the indoor microclimate, which undermines the rationale of simple natural ventilation strategies without humidity control.
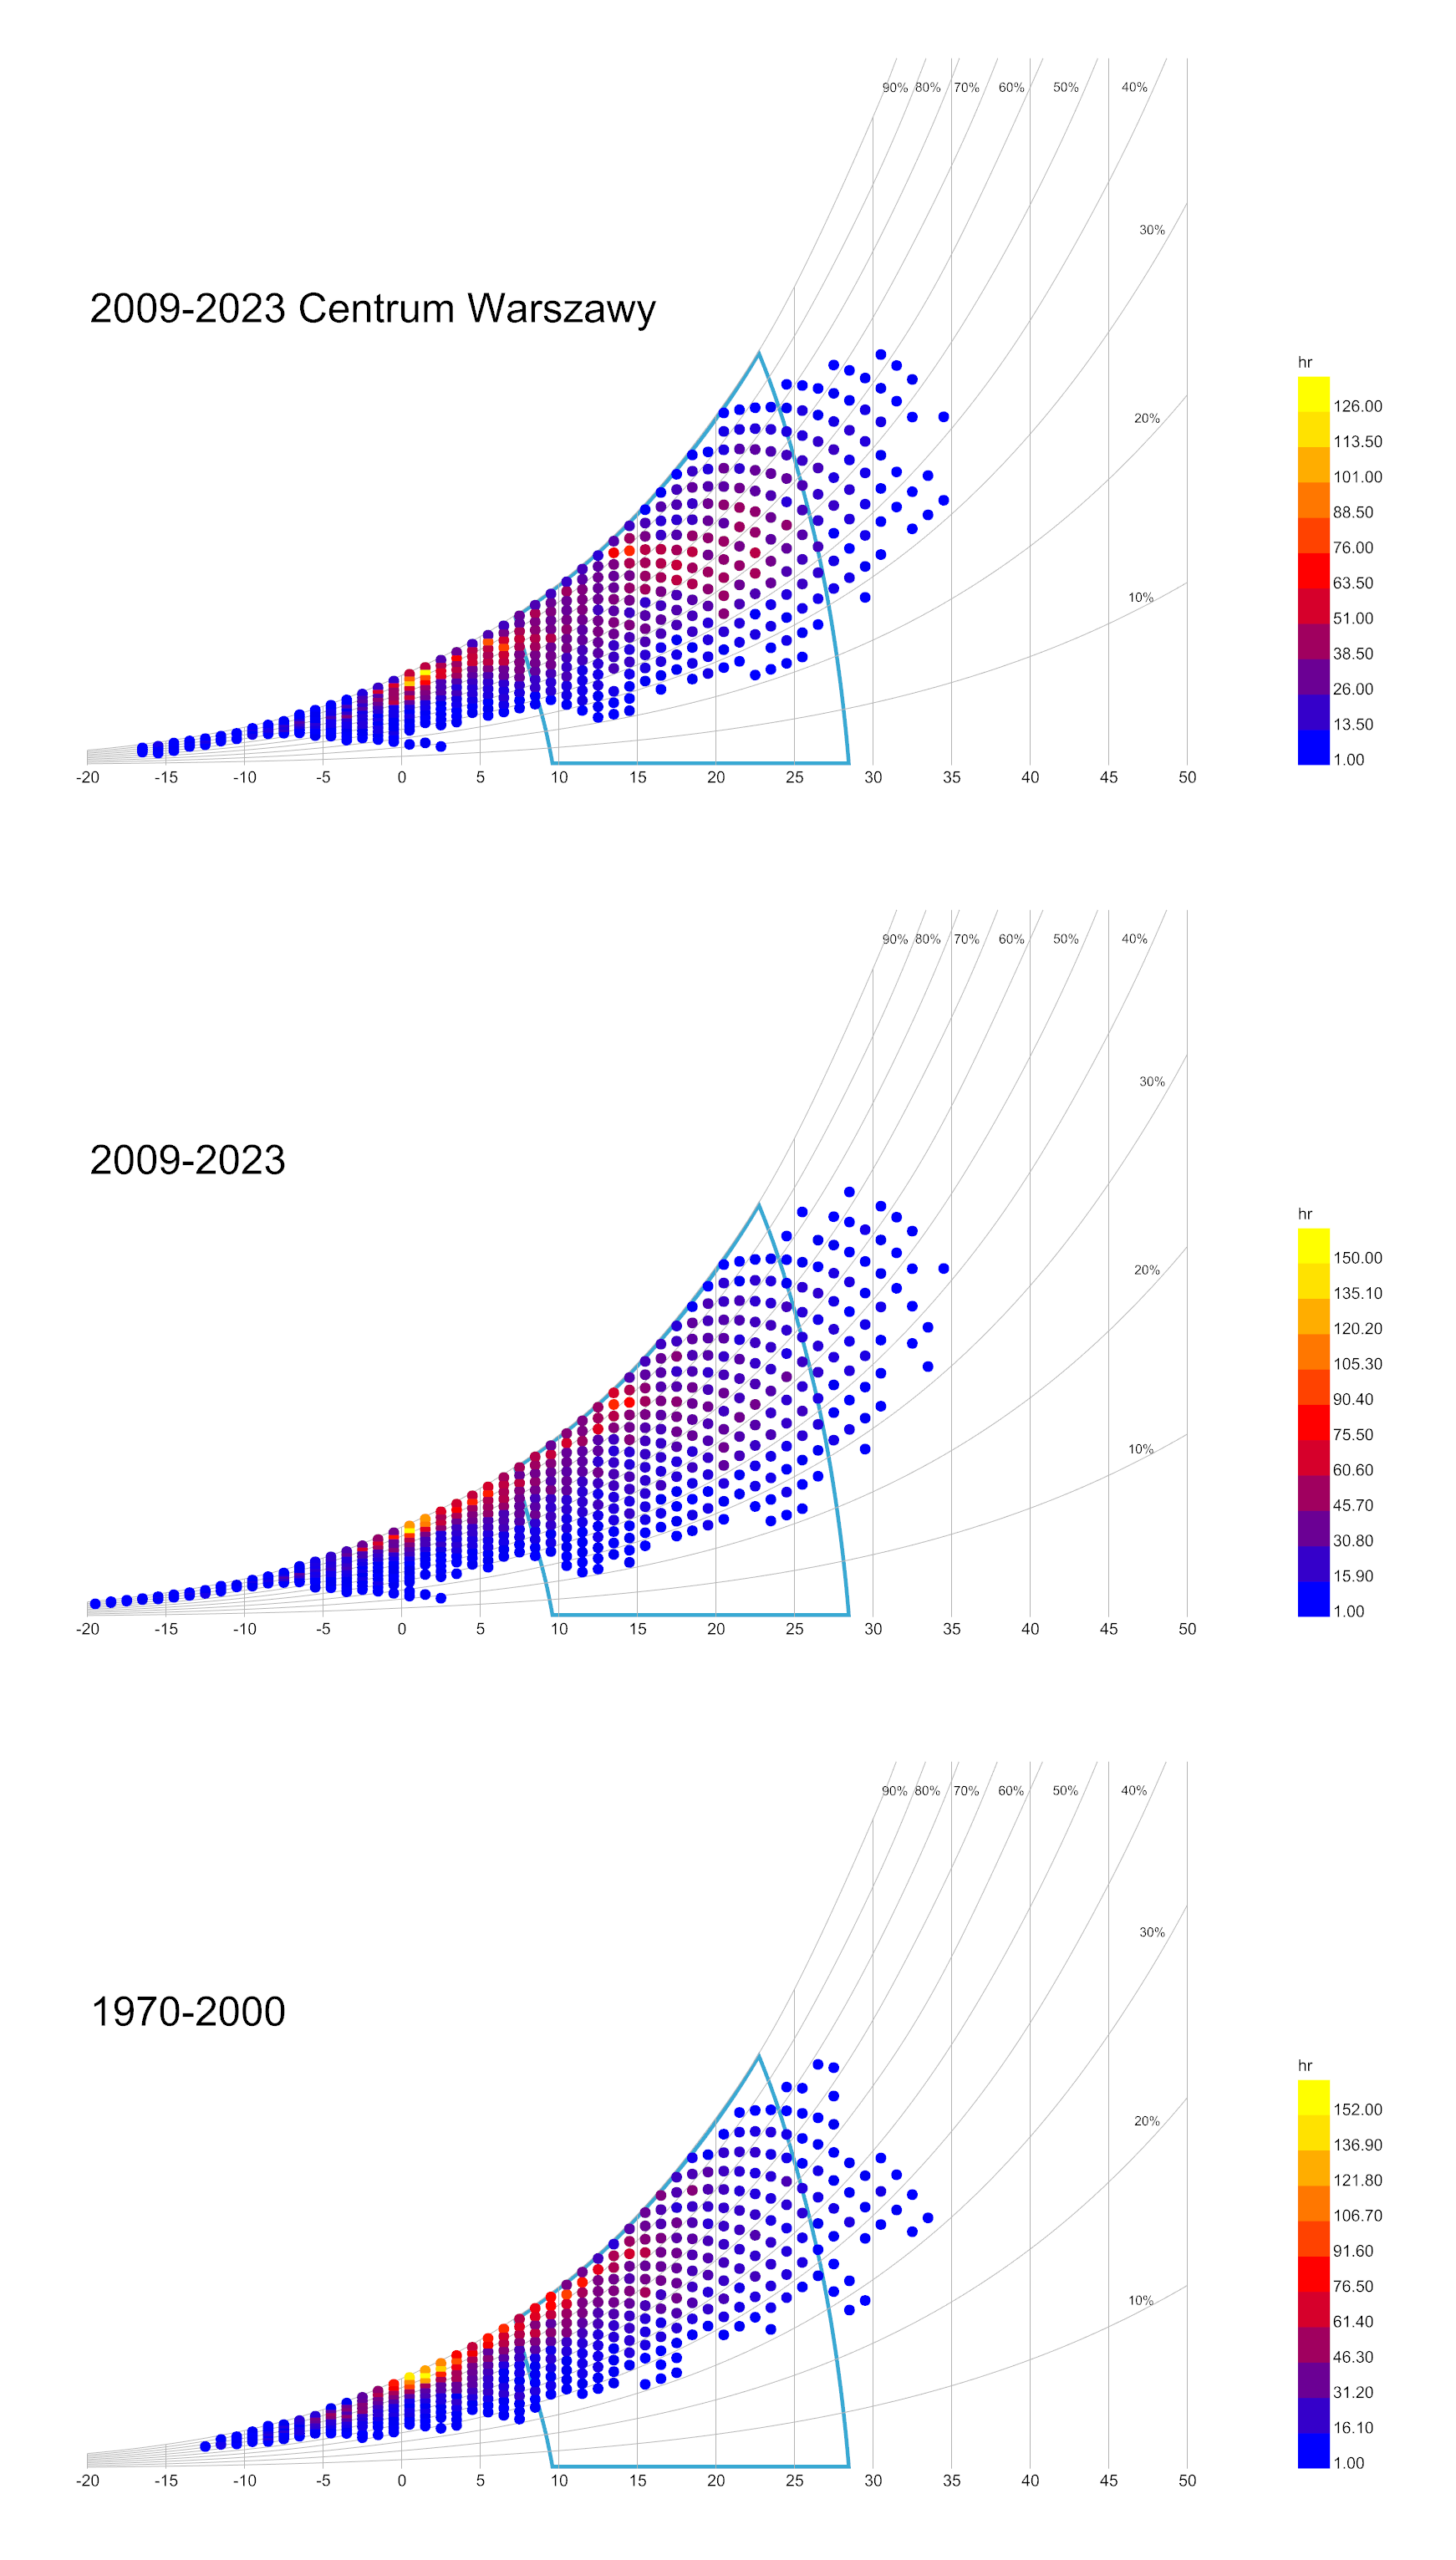
Fig. 3. Psychrometric charts for three scenarios: historical data (bottom), contemporary (middle), and contemporary city center (top). The shift of the point cloud to the right illustrates an increase in the number of hours with a temperature >30°C and high humidity, falling outside the passive comfort zone.
Enthalpy. Hidden energy costs
The increase in the number of hours with high enthalpy (70–80 kJ/kg) indicates the heightened significance of latent loads. Enthalpy is a measure of the total thermal energy contained in a unit mass of air. It is important to remember the physical relationship: as air temperature rises, its capacity to store water vapor increases. The accumulated moisture is a carrier of energy. For the user, high enthalpy means “heavy,” exhausting air that makes breathing difficult.
For a sanitary installation engineer, this is a signal of the necessity to change the approach to equipment selection. Cooling systems must remove not only sensible heat (associated with temperature) but also large amounts of moisture carrying stored energy (latent heat). Ignoring this component in the energy balance leads to the undersizing of installations or an increase in operational costs associated with the condensation and dehumidification process of ventilation air. Furthermore, the higher water vapor content in the atmosphere increases the potential for torrential rainfall, which must be taken into account when designing on-site water retention systems.
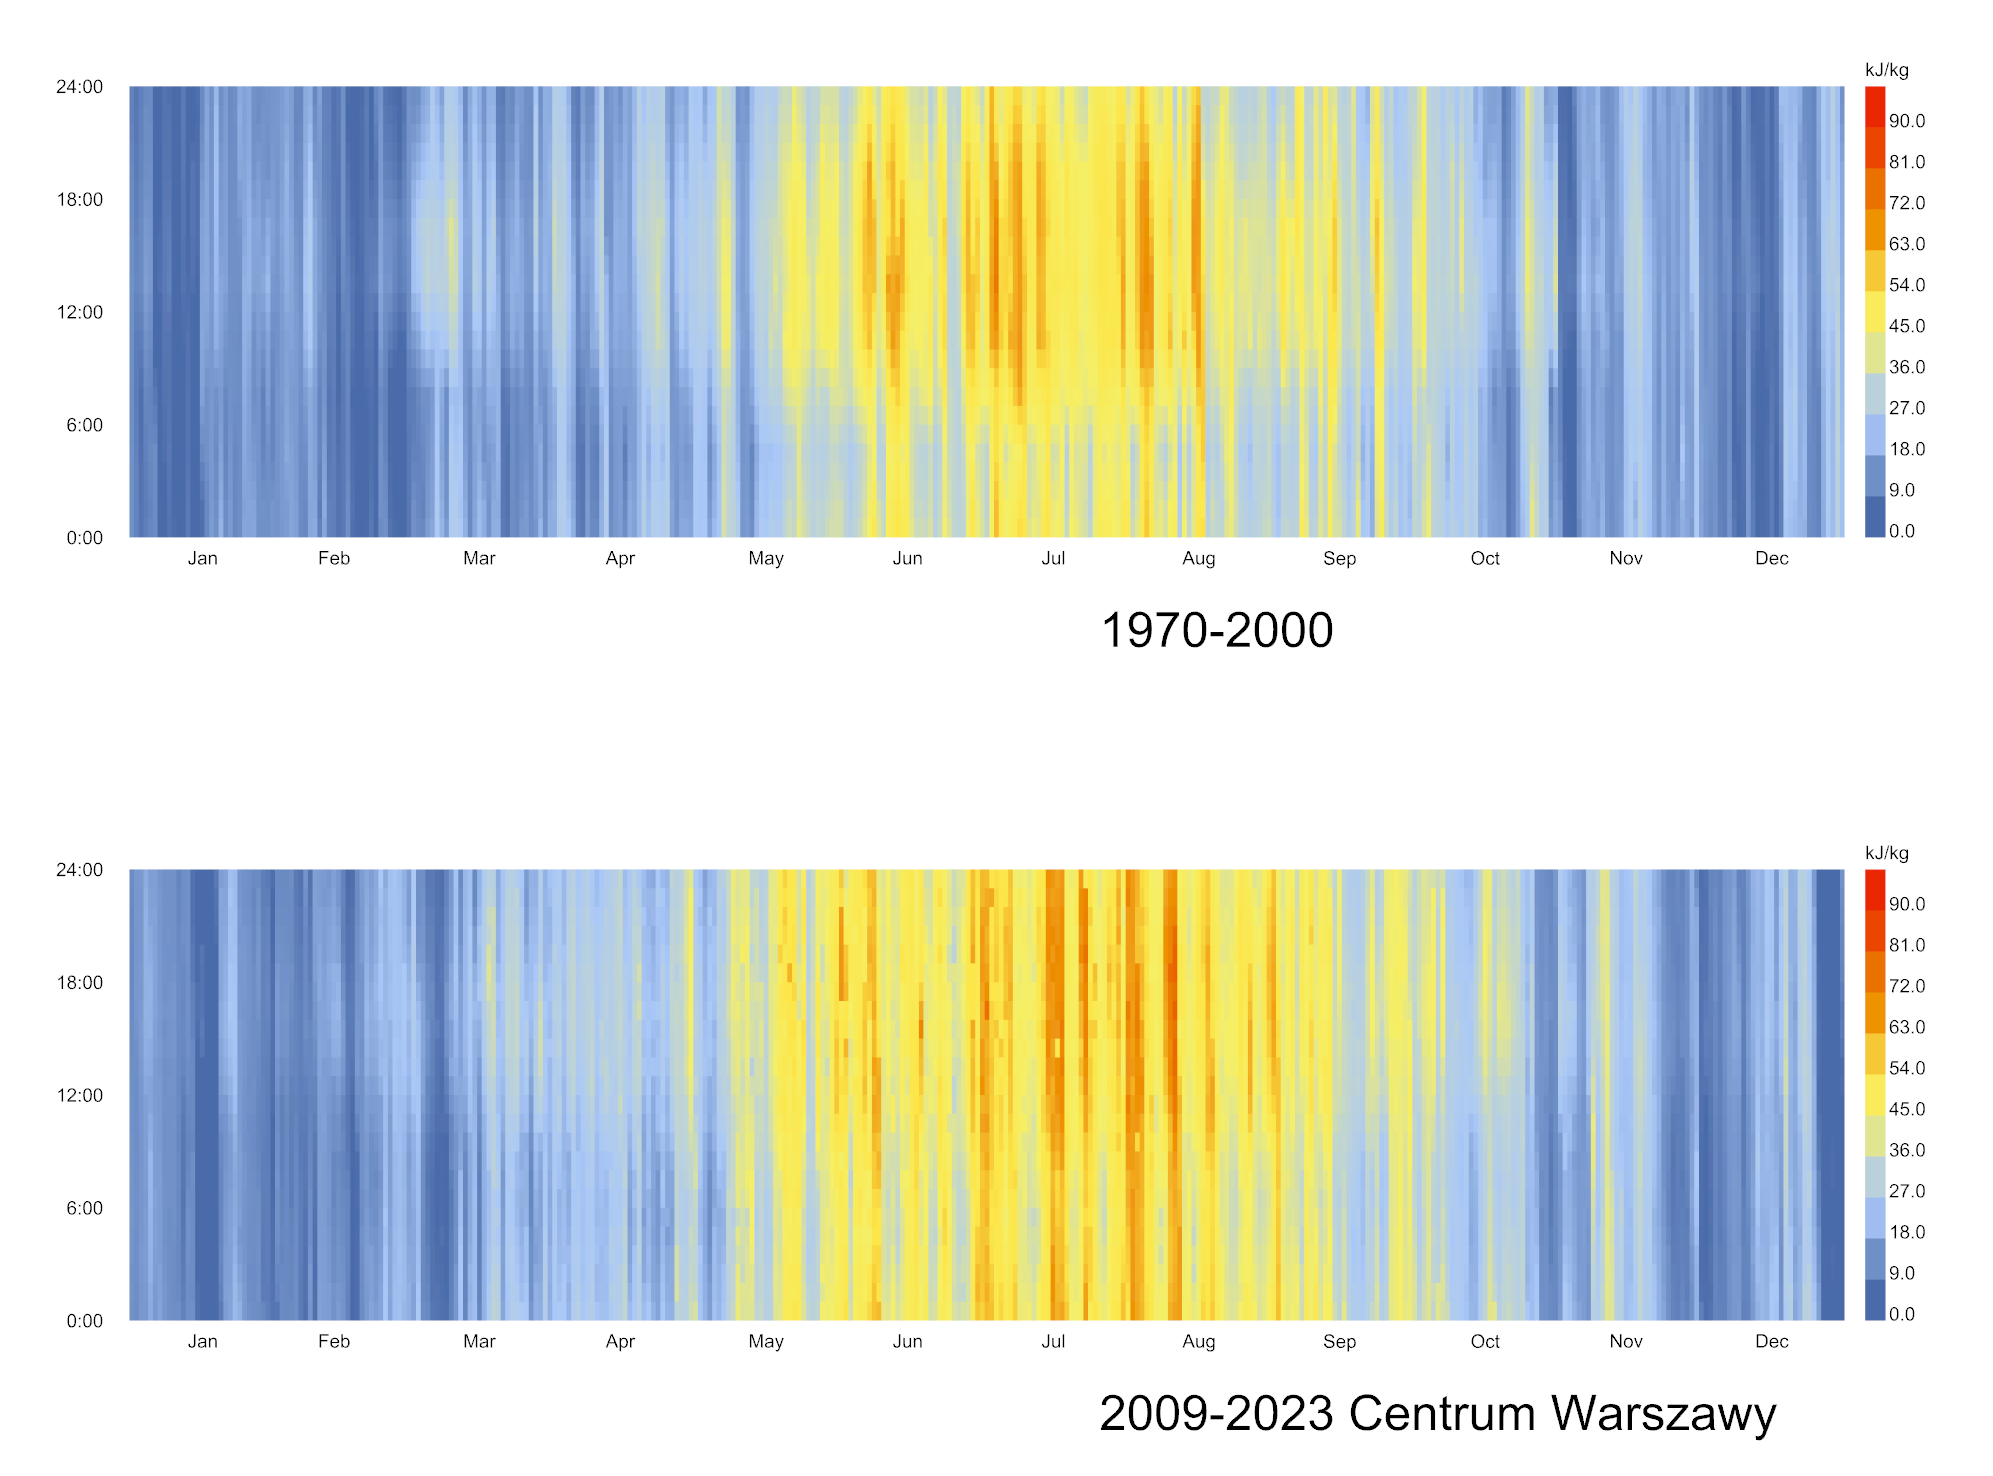
Fig. 4. Comparison of air enthalpy. Top graph (1970–2000) vs. bottom graph (2009–2023 Center). Darker colors on the bottom graph indicate an increase in the energy contained in the air, which translates to a higher load on air conditioning systems.
Solar radiation
Radiation roses are diagrams summing up the solar energy arriving from particular geographical directions. They allow for reading not only the intensity but also the structure of the radiation. An analysis of the roses indicates a significant share of diffuse radiation in the annual balance. This means that heat gains reach the building not only directly from the solar disc but from all sides of the sky vault as a result of light scattering in the atmosphere.
From the perspective of a person staying in a room, this means a lack of zones free from thermal impact, even without direct sun exposure. This enforces the use of advanced sun protection systems. Fixed louvers on the southern facade, effective against direct sunlight, prove insufficient against diffuse light. Effective protection requires movable or solid solutions capable of cutting off the energy supply arriving from any direction.
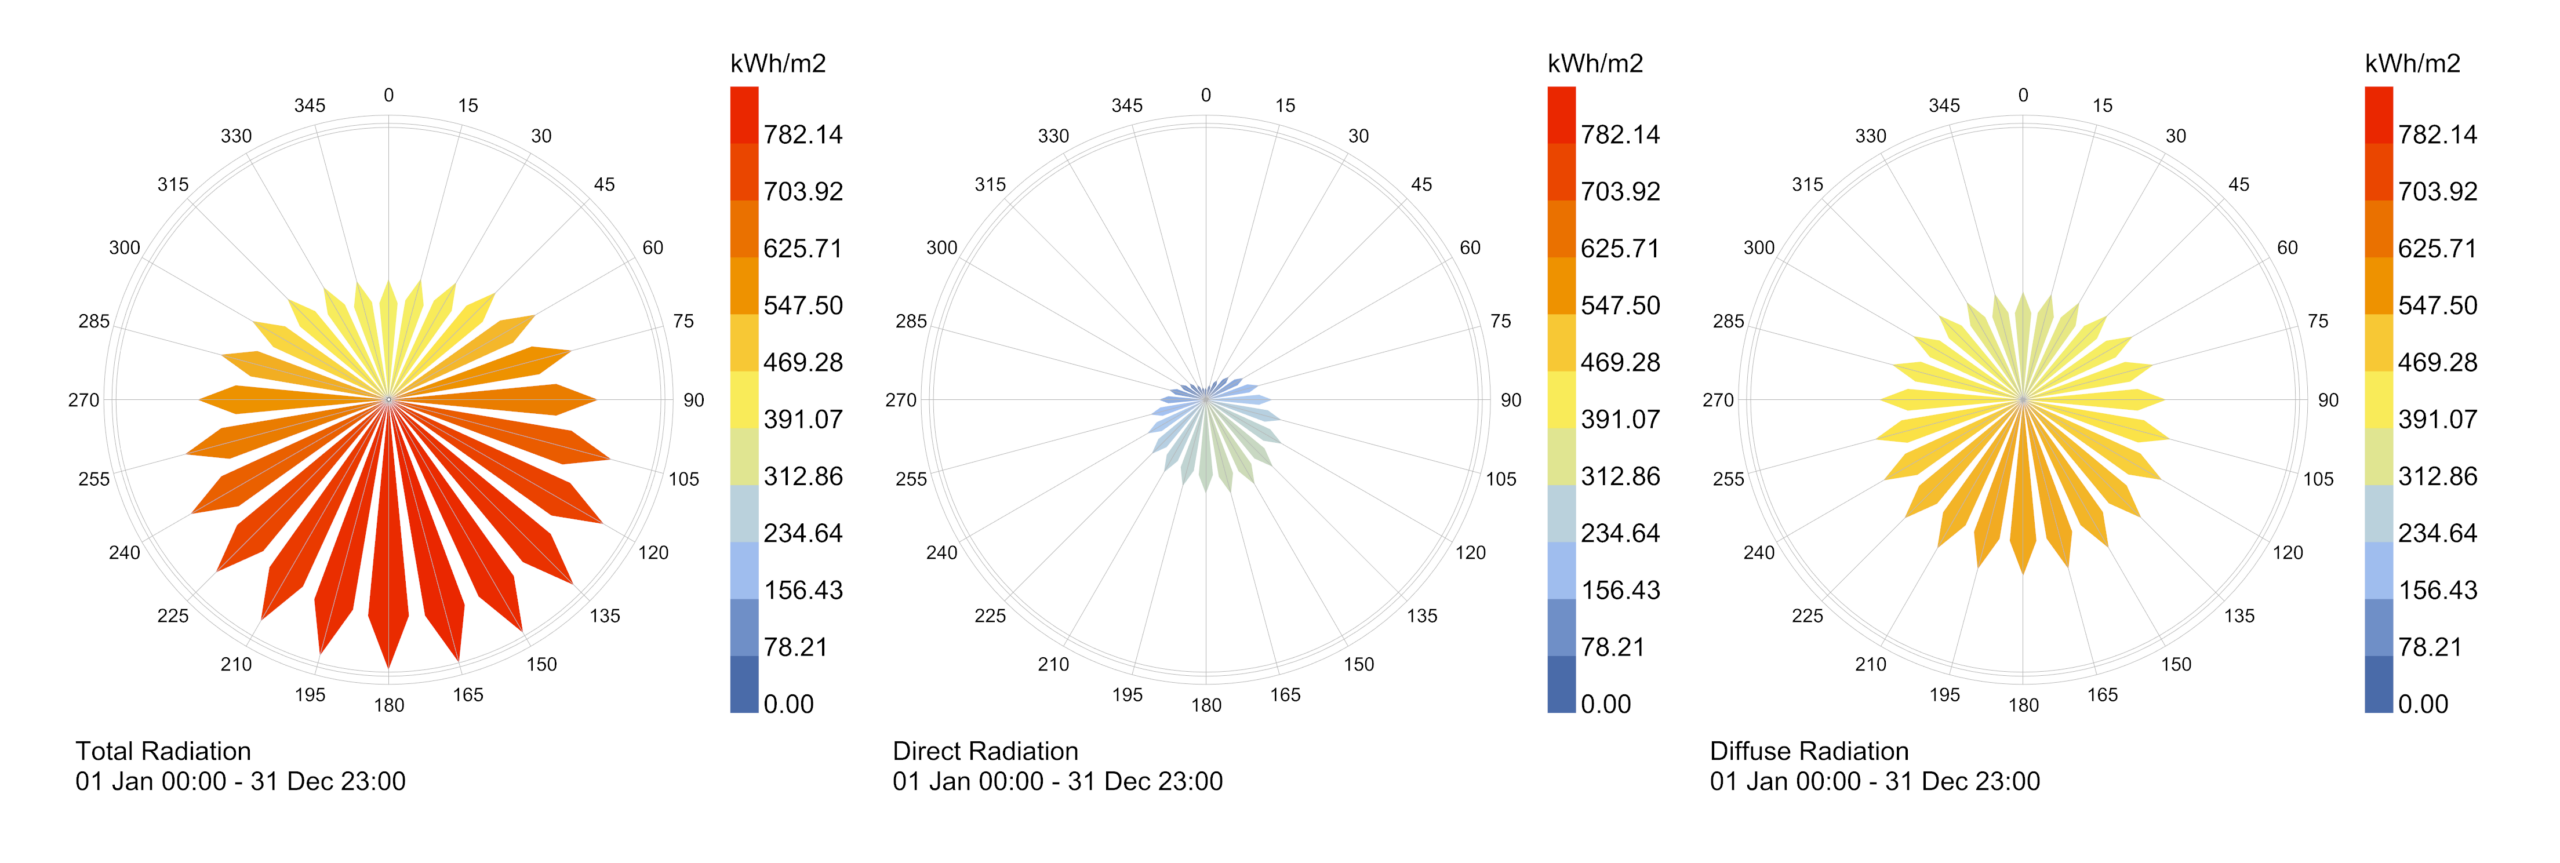
Fig. 5. Solar radiation roses (kWh/m2). The visible share of diffuse radiation justifies the use of movable external shading devices instead of fixed louvers.
Data as a design tool
The conclusions drawn from the analysis of contemporary climate data indicate the necessity to verify design priorities for Warsaw. The weight of the problems is shifting from heating to overheating control and moisture management. In this context, parametric environments, such as Grasshopper combined with Ladybug Tools plugins, become a tool with the potential to shape architecture in the early conceptual phase.
The use of current EPW files allows for precise testing of building mass variants and its orientation relative to the cardinal directions to minimize summer heat gains. It enables the design of unique, individually tailored shading devices that respond to the specific geometry of solar incidence. It also allows for the identification of areas prone to the formation of micro heat islands and the placement of green or blue infrastructure to eliminate them. Climate data analysis can influence the interior functional layout, suggesting the location of buffer zones on the sides most thermally loaded. Data-driven design thus becomes an element of the architect’s workshop, enabling the creation of buildings resilient to the challenges of a changing climate.